
Website Heatmap: How to Read Click and Scroll Heatmaps
Website heatmap guide: click heatmaps and scroll maps, heatmap analysis step by step, sample size, common mistakes and how to pick the right tool.
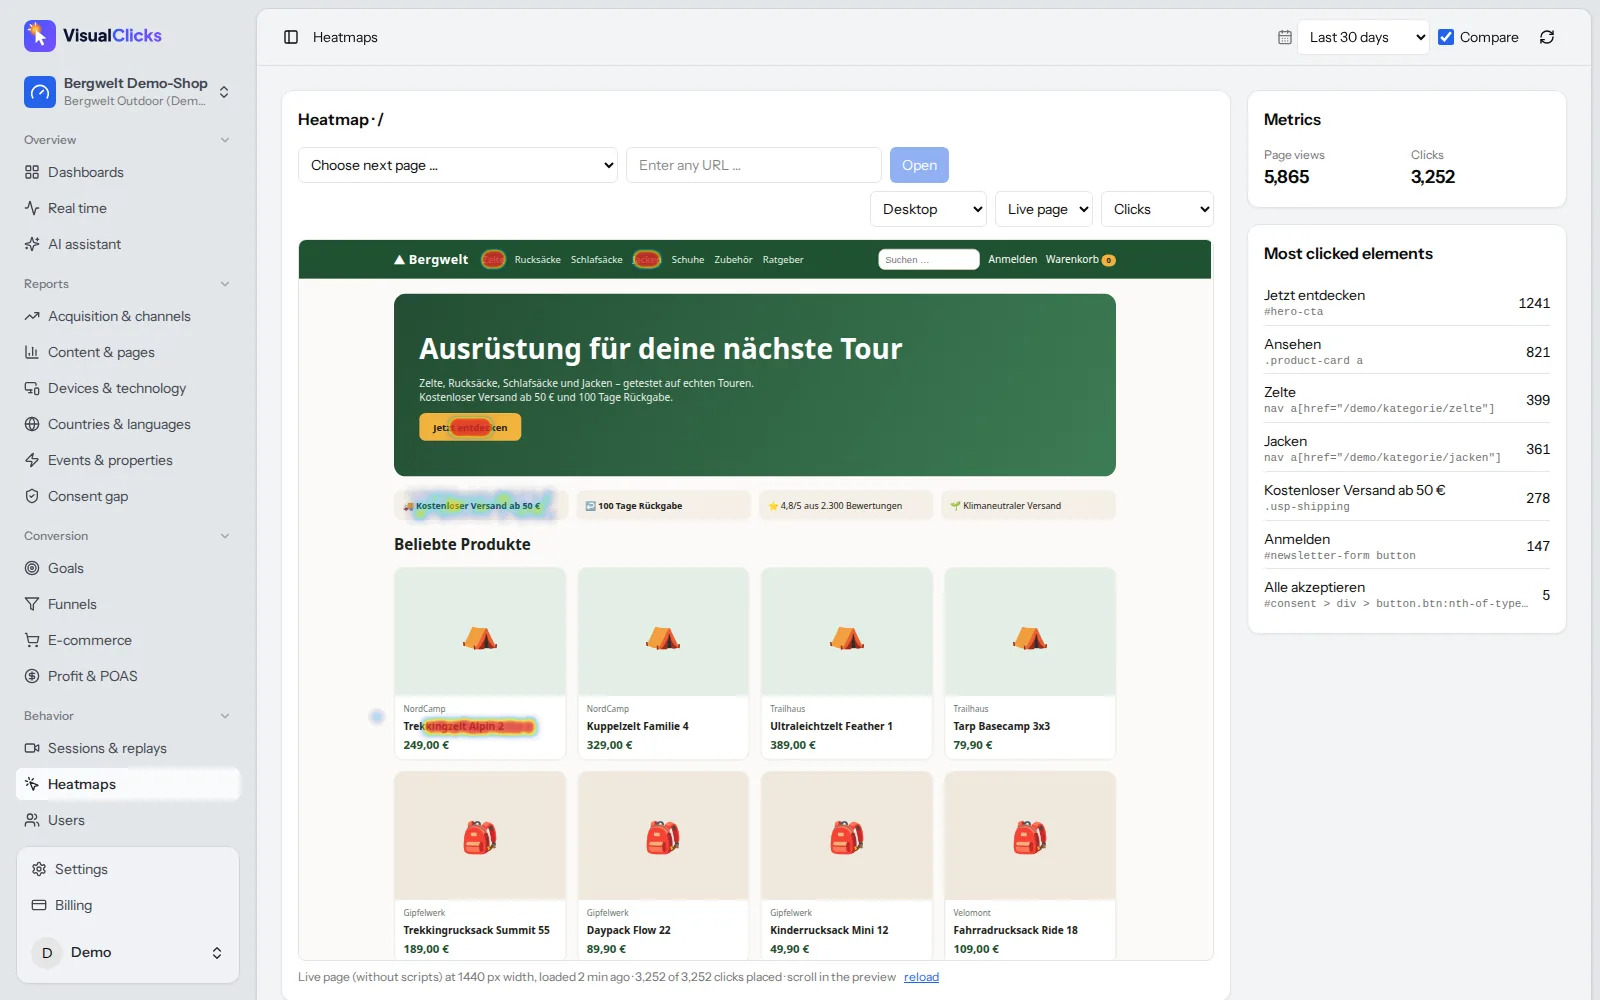
A website heatmap shows you in colour where visitors click, how far they scroll and which areas they ignore. Red means lots of activity, blue means little – the principle is simple, but heatmaps are surprisingly easy to misread. In this guide you learn the main heatmap types, how to do a heatmap analysis step by step, which patterns actually mean something, how much data you need, and what to look for when choosing a heatmap tool.
What is a website heatmap?
A website heatmap is a visualisation that aggregates the behaviour of many visitors on a single page. Instead of tables of click counts, you see the page itself, overlaid with a colour scale: areas with many interactions are warm (yellow, orange, red), areas with few are cold (green, blue).
The advantage over classic analytics reports: you do not just see that a page converts poorly, you see where on the page attention goes – and where it does not. A heatmap answers questions like:
- Does anyone click the most important button?
- Are visitors clicking on things that are not clickable?
- Do people reach the form at the bottom of the page?
- Is an element distracting from the main action?
What a heatmap does not answer is why visitors behave the way they do. For that, combine it with session replays, funnels and, where possible, user surveys.
The main types of heatmaps
| Heatmap type | What it shows | Typical question |
|---|---|---|
| Click heatmap | Where people click or tap | Which elements attract clicks, which are ignored? |
| Scroll map | What share of visitors reaches each part of the page | How many see content below the first screen? |
| Move map | Where the mouse cursor hovers (desktop only) | Which areas do people skim? |
| Attention map | How long areas were visible in the viewport | Where do visitors linger while reading? |
| Area map | Total clicks inside a selected region | How many clicks does an entire block, such as a teaser, get? |
For most questions, click heatmaps and scroll maps are enough. Treat move maps with caution: mouse position is only a rough hint of where someone is looking, and there is no cursor on smartphones.
Click heatmap
A click heatmap shows every click or tap on a page. Good tools add a list of the most clicked elements with absolute numbers. That matters because colours are relative: a red spot on a page with 50 views says less than a yellow one on a page with 50,000.
Technically there are two approaches: the tool either stores the click position in pixels, or it anchors the click to the element that was clicked. On responsive websites, the second approach is much more accurate because elements move depending on screen width.
Scroll map
A scroll map colours the page from top to bottom by the share of visitors who reached each height. The top is always 100%, and the share decreases further down. What matters is not the colour but the points where the share drops sharply.
Heatmap analysis: how to read a heatmap
A heatmap analysis does not start with the heatmap – it starts with a question. Without one, you stare at colourful blobs and always find something "interesting".
- Define the page goal. What should a visitor do here? Buy, submit a form, move on to a product page?
- Pick a device. Analyse desktop, tablet and smartphone separately. Layout and behaviour differ so much that a combined heatmap tells you very little.
- Check the time range and sample. How many page views are in the heatmap? Did the page change during the period?
- Start with the scroll map. It tells you which part of the page is actually seen. Clicks below the point only 20% of visitors reach will naturally be rare.
- Then the click heatmap and element list. Does the main action get the most clicks? Where do the rest go?
- Segment. Compare new and returning visitors, or different channels. Visitors from an ad behave differently from loyal customers.
- Watch replays. For every striking pattern, watch a handful of sessions to understand the "why".
- Form a hypothesis and test it. Turn the observation into a concrete change and measure its effect.
Patterns that actually mean something
- Clicks on non-clickable elements. Images, icons, underlined text or product features often get clicked because visitors expect more information. Make them clickable or style them so they do not look like links.
- Ignored call to action. The main button gets few clicks while the navigation gets many. Common causes: it does not look like a button, it sits below the typical scroll depth, or the offer above it is not convincing.
- Clicks concentrated in the navigation. Lots of menu clicks on a landing page often mean visitors cannot find what they are looking for on the page.
- False bottom. The scroll map drops abruptly even though important content follows. A large gap, a full-width image or a block of colour often looks like the end of the page.
- Repeated clicks on form fields. Many clicks on the same field can signal input problems. Check in replays.
- Repeated clicks on the same spot. Rage clicks point to elements that do not respond, or respond too slowly.
How much data does a heatmap need?
There is no fixed minimum – it depends on how big a difference you want to detect. As a rule of thumb, a few dozen page views only reveal obvious outliers. For reliable statements about individual elements, aim for several hundred to over a thousand page views per device type.
Three things matter more than the absolute number:
- Count per device. 1,000 views of which 850 are mobile means only 150 for the desktop heatmap.
- Keep the page version constant. If the page changed during the period, two versions get mixed. Start a new period after major changes.
- Check absolute numbers. Always look at the click count per element alongside the colour. A "hot" area with 12 clicks is an anecdote, not a pattern.
With little traffic, group similar pages (for example all product pages in a category) or extend the time range.
Common heatmap mistakes
- All devices in one heatmap. Desktop and mobile layouts differ; mixed data creates phantom hotspots.
- Outdated screenshots. Some tools overlay clicks on a screenshot taken once. When the page changes, clicks and layout no longer match.
- Ignoring dynamic content. Sliders, pop-ups, cookie banners and expandable menus change what a visitor sees. Clicks on a pop-up may appear on top of the content beneath it.
- Reading colour without context. Colour scales are relative to the page. Never compare the colours of two heatmaps – compare the numbers.
- Inferring causes from the heatmap alone. A heatmap shows what, not why. Without replays or surveys, interpretations remain guesses.
- No follow-up measurement. A change without measuring click-through or conversion afterwards is just an opinion.
Choosing a website heatmap tool
Many tools offer heatmaps, including Hotjar, Microsoft Clarity, Mouseflow and VisualClicks. Microsoft Clarity, for example, offers click, scroll, area, conversion and attention maps (Microsoft Learn: Heatmaps overview), and a Hotjar heatmap covers click, move and scroll data, among others. Rather than choosing by brand, check these criteria:
| Criterion | What to look for |
|---|---|
| Rendering | Live copy of the current page or a static screenshot? |
| Accuracy | Are clicks anchored to elements so they stay correct at every screen width? |
| Devices | Separate heatmaps for desktop, tablet and smartphone? |
| Numbers | A list of most clicked elements with absolute values? |
| Context | Connected to session replays, funnels and web analytics? |
| Privacy | Server location, input masking, consent controls |
| Performance | Size of the tracking script and impact on load time |
Heatmaps and privacy
Heatmaps process interaction data from visitors. Whether you need consent depends on how the tool works technically – for example whether it stores or reads information on the device (covered by the ePrivacy rules in the EU) and what data it sends where (GDPR). Look for a provider with EU servers, a data processing agreement and clear documentation. For a closer look at one popular free tool, read our article on Microsoft Clarity. This section is not legal advice.
How VisualClicks helps with heatmap analysis
VisualClicks combines heatmaps with web analytics, replays and funnels in one tool:
- Click and scroll heatmaps on a live copy of the page. You see the heatmap on the current version of the page, not an old screenshot.
- Clicks anchored to elements. Clicks stay correctly mapped across different screen widths.
- Desktop, tablet and smartphone separately – plus a list of the most clicked elements with numbers.
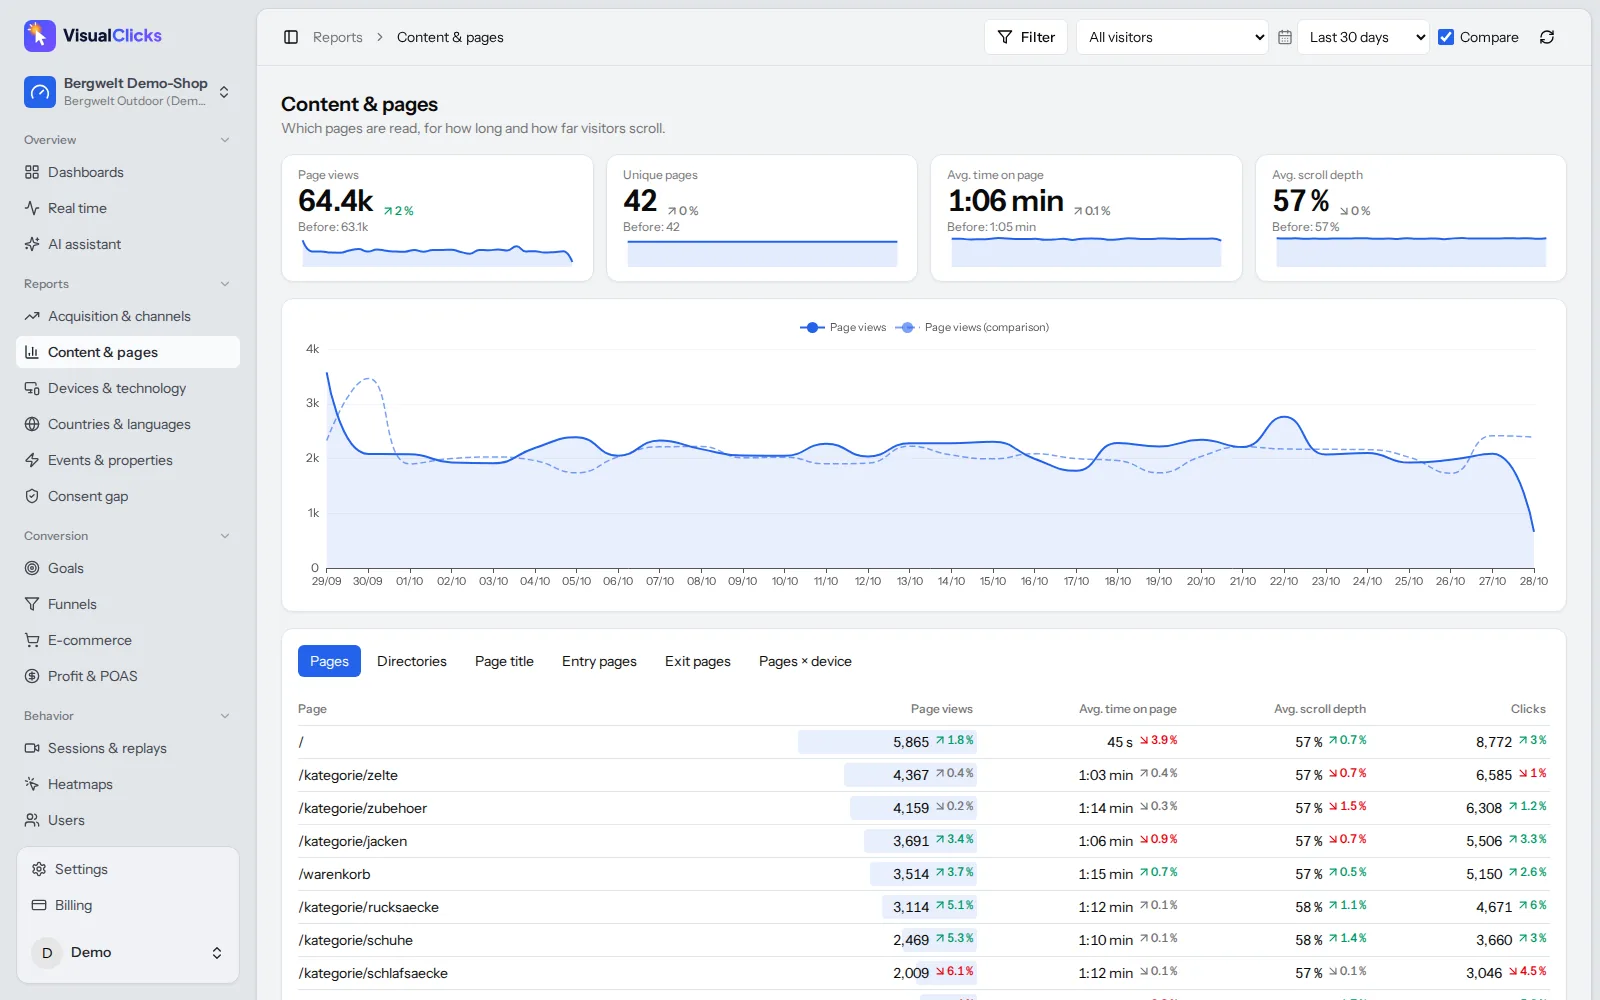
- Scroll depth in the pages report. For every page you see views, time on page, scroll depth and entry and exit pages, so you can spot the pages where a heatmap analysis pays off.
- Session replays for the why. Rage-click detection and sorting by frustration help you quickly find the sessions that explain a striking pattern.
See all details under session replay & heatmaps, page reporting under web analytics and our approach to privacy under privacy-friendly tracking.
Conclusion: heatmaps show the what, not the why
A website heatmap is one of the fastest ways to make problems visible: ignored buttons, wrong click expectations, content nobody reaches. It only delivers value with a clear question, separate devices, enough data and a focus on absolute numbers rather than colours. Combine click heatmaps and scroll maps with session replays, turn what you see into concrete hypotheses, and measure after every change whether it worked.
Frequently asked questions
What is a website heatmap?
A website heatmap aggregates the behaviour of many visitors on one page into a colour overlay. Warm colours show areas with many clicks or high scroll reach, cold colours show areas with little activity. It lets you see directly on the page what gets attention and what is ignored.
How do you read a heatmap?
Start with a clear question and analyse each device separately. Look at the scroll map first to see which parts of the page are actually seen, then at the click heatmap and the list of most clicked elements. Always check absolute numbers, not just colours, and use session replays to understand why a pattern occurs.
How much traffic do you need for a heatmap?
There is no fixed minimum. As a rule of thumb, a few dozen page views only reveal obvious outliers; for reliable conclusions about individual elements, aim for several hundred to over a thousand page views per device type.
Are heatmaps GDPR compliant?
It depends on the tool: whether it stores or reads information on the device, what data it processes and where its servers are. Look for EU hosting, a data processing agreement and input masking. This is not legal advice.
What is the difference between a heatmap and a session recording?
A heatmap combines many visits into one picture of a page and shows what happens. A session recording replays a single visit and helps you understand why something happens. They work best together.
More articles
 Privacy
Google Analytics Alternative: 5 Tools Compared on the Facts
Why teams leave Google Analytics, what GDPR requires, how cookieless analytics works – and how GA4, Matomo, Plausible, Fathom and VisualClicks compare on verifiable facts.
Read more →
 AI visibility
Generative Engine Optimization: How to Get Cited by AI
How AI assistants choose their sources, the seven levers that get you cited, and the tools you need to measure AI visibility on three levels.
Read more →
 Web analytics
What Are UTM Parameters? Meaning, Examples and How to Use Them
What UTM parameters mean, how to build and name UTM links step by step and how to read them in Google Analytics – with a builder template, AI traffic tips and common mistakes.
Read more →
See your website through new eyes
Request your access. After that, one line of tracking code is all it takes – the first visits show up in real time.