
ROAS Calculation: Formula, Break-Even ROAS and POAS Explained
ROAS calculation formula with worked examples: break-even ROAS, POAS with margin, shipping, fees and returns. Learn to steer ad spend by profit.
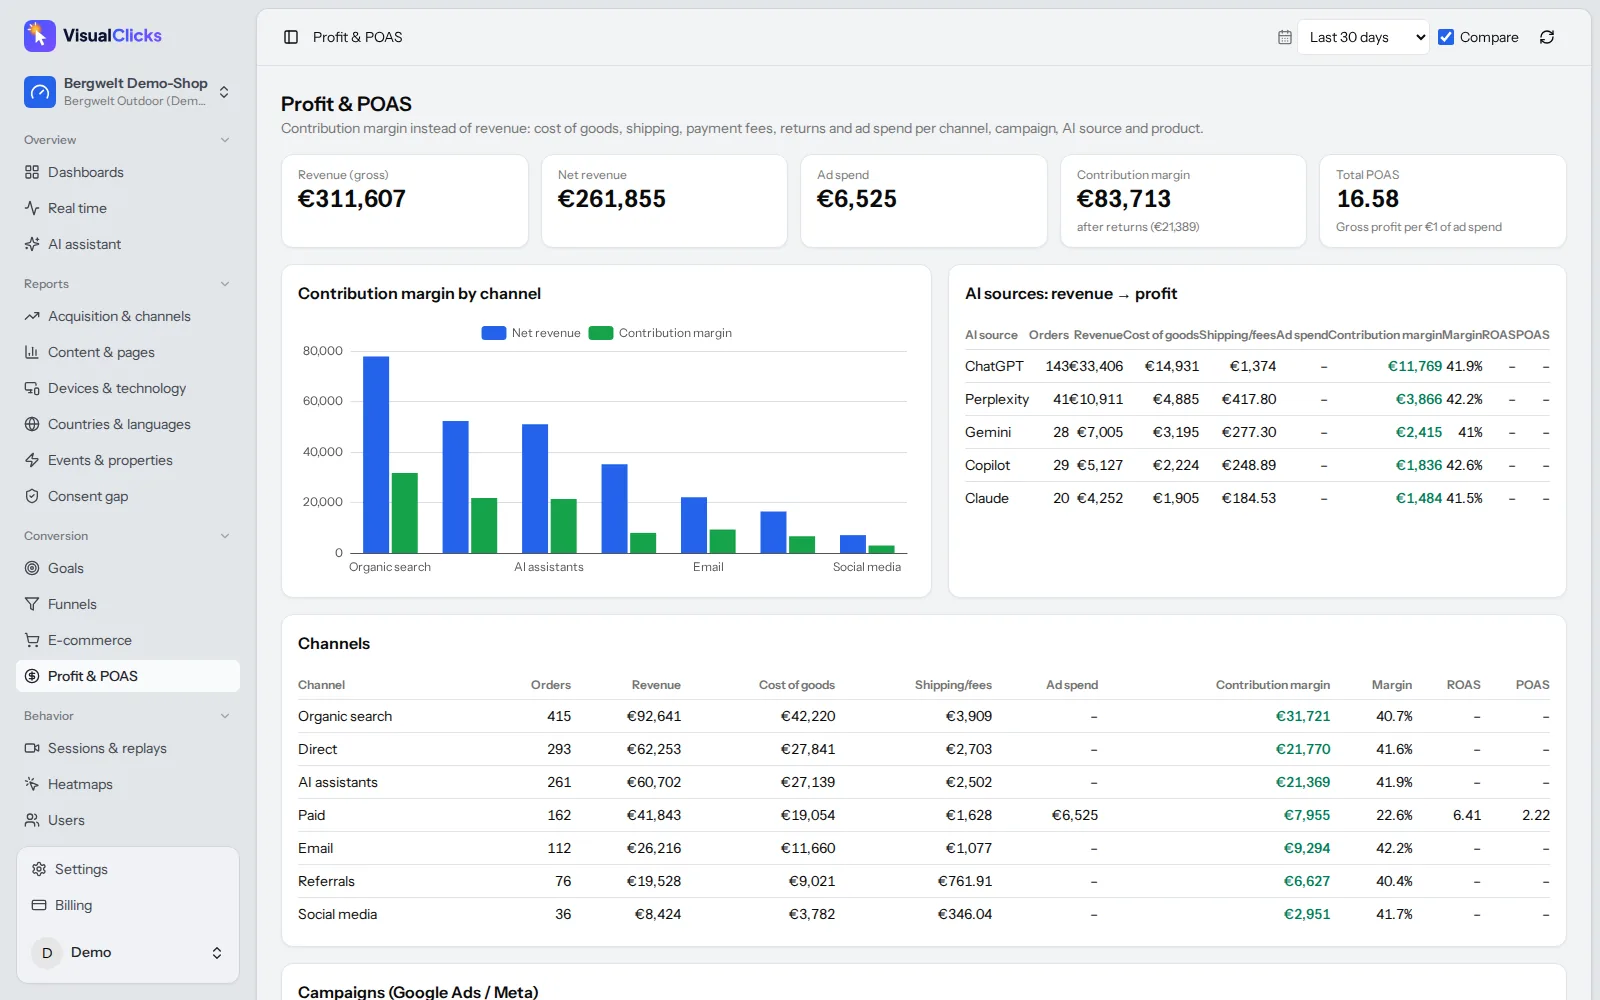
ROAS calculation takes seconds: revenue divided by ad spend. That simplicity is exactly why the metric is so popular – and so risky. A ROAS of 6 can lose money while a ROAS of 4 is highly profitable. In this guide you get the ROAS calculation formula, the break-even ROAS, and POAS (profit on ad spend), two fully worked examples that include margin, shipping, payment fees and returns, and a clear explanation of why revenue-based bidding in Google Ads and Meta Ads can steer you in the wrong direction.
What is ROAS?
ROAS stands for return on ad spend. It tells you how much revenue each dollar of advertising generates. You can look at it per campaign, ad group, channel or product, and it is the default success metric in Google Ads, Meta Ads and most other ad platforms.
Just as important is what ROAS is not: it is not a profit metric. It says nothing about how much of that revenue is left after product cost, shipping, payment fees and returns. For that you need the break-even ROAS – or, better, POAS.
Related metrics you will come across:
- ACoS (advertising cost of sale): ad spend ÷ revenue, common on Amazon. It is the inverse of ROAS. A ROAS of 5 equals an ACoS of 20%.
- ROI (return on investment): compares profit, not revenue, with the investment.
- POAS (profit on ad spend): compares contribution margin with ad spend.
ROAS calculation formula
The ROAS formula is straightforward:
ROAS = revenue from ads ÷ ad spend
To express it as a percentage, multiply by 100:
ROAS (%) = (revenue from ads ÷ ad spend) × 100
Example: a Google Shopping campaign costs $2,000 per month and generates $9,000 in revenue.
- ROAS = $9,000 ÷ $2,000 = 4.5 (often written 4.5x or 4.5:1)
- ROAS in % = 450%
- ACoS = $2,000 ÷ $9,000 = 22.2%
Google Ads uses the percentage notation for its Target ROAS bid strategy: a target of 450% means $4.50 in conversion value for every $1 spent (Google Ads Help: About Target ROAS bidding).
Which revenue belongs in the ROAS calculation?
For a ROAS calculation you can act on, pick one revenue definition and use it everywhere:
| Question | Recommendation |
|---|---|
| Gross or net of tax? | Net of VAT or sales tax. The tax is not yours. |
| Shipping charged to the customer? | Include it everywhere or exclude it everywhere – just be consistent. |
| Returns and cancellations? | Deduct them as soon as they are known. Otherwise ROAS is systematically too high. |
| Which attribution model? | The same one you use for your break-even value. Last click and data-driven attribution assign different revenue to each campaign. |
Many stores send the full basket value including tax and shipping to Google Ads. The platform ROAS is then higher than the ROAS you use internally. That is fine as long as you know it – and calculate your break-even ROAS on the same basis.
Break-even ROAS: when does advertising pay off?
Break-even ROAS is the ROAS at which a campaign makes neither profit nor loss. Below it you lose money, above it you earn.
Break-even ROAS = 1 ÷ contribution margin
Contribution margin is the share of revenue left after all variable costs – but before ad spend. Variable costs typically include:
- Cost of goods sold (purchase price or production cost)
- Shipping and packaging
- Payment fees (card processing, PayPal, buy-now-pay-later providers)
- Cost of returns (return shipping, restocking, unsellable items)
- Marketplace or fulfilment fees, if any
Example: if $25 of every $100 in net revenue remains after variable costs, your margin is 25%.
- Break-even ROAS = 1 ÷ 0.25 = 4.0 (400%)
Any campaign below a ROAS of 4 costs you money – even if a ROAS of 3 looks "good" in industry benchmarks.
| Contribution margin | Break-even ROAS |
|---|---|
| 50% | 2.0 |
| 40% | 2.5 |
| 30% | 3.33 |
| 25% | 4.0 |
| 20% | 5.0 |
| 10% | 10.0 |
Target ROAS with a profit goal
Break-even means zero profit. If you want to keep a certain share of revenue as profit after ad spend, subtract it from the margin:
Target ROAS = 1 ÷ (contribution margin − target profit share)
Example: 30% margin, and you want to keep 10% of revenue as profit after ads. Target ROAS = 1 ÷ (0.30 − 0.10) = 5.0.
What does POAS mean?
POAS means profit on ad spend. It replaces revenue in the numerator with contribution margin:
POAS = contribution margin (before ad spend) ÷ ad spend
The POAS meaning is much easier to interpret than ROAS because the threshold is the same for every product:
- POAS > 1: the campaign makes money.
- POAS = 1: break-even.
- POAS < 1: the campaign costs more than it returns in contribution margin.
You can also read profit directly: profit after ads = ad spend × (POAS − 1).
Note: some tools define POAS as (contribution margin − ad spend) ÷ ad spend, which moves break-even to 0 instead of 1. Always check which definition a report uses. This article uses the version where break-even is 1.
How to calculate POAS step by step
- Take the campaign's net revenue (excluding tax).
- Subtract returns – the revenue of orders sent back.
- Subtract cost of goods for the items customers kept.
- Subtract shipping for all orders sent, plus return shipping.
- Subtract payment fees.
- The result is your contribution margin. Divide it by the campaign's ad spend.
Worked example: ROAS vs. POAS
Two campaigns, same budget. Which one would you scale?
Example with made-up figures: average order value $100 net, shipping $5 per parcel, return shipping $5 per return, payment fees 2% of revenue.
| Campaign A (own brand) | Campaign B (third-party fashion) | |
|---|---|---|
| Ad spend | $1,000 | $1,000 |
| Orders | 50 | 60 |
| Net revenue | $5,000 | $6,000 |
| ROAS | 5.0 | 6.0 |
| Return rate | 10% | 25% |
| Revenue after returns | $4,500 | $4,500 |
| Cost of goods (50% / 75%) | $2,250 | $3,375 |
| Shipping ($5 × orders) | $250 | $300 |
| Return shipping ($5 × returns) | $25 | $75 |
| Payment fees (2%) | $100 | $120 |
| Contribution margin before ads | $1,875 | $630 |
| POAS | 1.88 | 0.63 |
| Profit after ad spend | +$875 | −$370 |
Campaign B has the higher ROAS and looks better in the ad account. In reality it loses 37 cents on every dollar spent. Campaign A earns 88 cents per dollar.
Break-even ROAS tells the same story:
- Campaign A: margin = $1,875 ÷ $5,000 = 37.5% → break-even ROAS = 2.67. A ROAS of 5.0 is comfortably above.
- Campaign B: margin = $630 ÷ $6,000 = 10.5% → break-even ROAS = 9.52. A ROAS of 6.0 is far below.
The gap comes from three things ROAS ignores entirely: lower product margin, a higher return rate, and more parcels per dollar of revenue.
Why revenue-based bidding misleads
Smart Bidding strategies such as Target ROAS or Maximize conversion value optimise for the conversion value you send to the platform. If that value is revenue, the algorithm learns exactly that: to maximise revenue, not profit. The usual consequences:
- Low-margin bestsellers get favoured. An $800 TV with an 8% margin counts for more than an $80 accessory with a 60% margin.
- Returns are invisible. The platform sees the order, not the parcel that comes back three weeks later. Product groups with high return rates look permanently better than they are.
- Discounts distort. A coupon cuts margin far more than it cuts revenue. Campaigns with heavy coupon usage barely change in ROAS.
- One target for everything. A single Target ROAS across the whole catalogue is too cautious for high-margin products and too aggressive for low-margin ones.
What to do instead
- Set a Target ROAS per margin group. Split products by margin into campaigns or asset groups and give each its own target using the formula above.
- Send contribution margin instead of revenue as the conversion value. Smart Bidding then optimises for profit, and your Target ROAS effectively becomes a target POAS – 100% is break-even.
- Correct for returns. Google Ads lets you adjust or retract conversion values after the fact, so the algorithm does not learn from orders that are later returned.
- Manage internally by POAS. Even if you keep bidding on revenue in the platform, base budget decisions on contribution margin.
All four require product costs, order costs and campaign costs in one place. Clean campaign attribution with UTM parameters is the foundation that makes revenue and cost match up in the first place.
Common mistakes in ROAS calculation
- Mixing gross and net. Revenue including tax in the numerator, margin on a net basis in the break-even – and your comparison is off by the tax rate.
- Trusting platform ROAS blindly. Google Ads and Meta Ads use their own attribution windows. If someone buys after seeing a Google ad and an Instagram ad, the sale can show up in both accounts. The sum of platform revenue then exceeds your actual revenue.
- Missing conversions due to consent. Without consent, ad platforms miss some purchases or only model them. The reported ROAS can be lower or higher than reality depending on the modelling.
- Treating new and returning customers the same. A brand campaign that mostly catches existing customers almost always has a high ROAS but often adds little incremental revenue.
- Looking only at campaigns, not products. A campaign with a good POAS can contain individual products that lose money. Check both levels.
- Too short a time frame. With few orders, ROAS swings wildly. A week with five orders is no basis for a budget decision.
How VisualClicks helps with ROAS and POAS
The hard part of POAS is not the formula but the data: revenue, returns, product costs, shipping, payment fees and ad spend usually live in five different systems. VisualClicks brings them together:
- Ad cost import from Google Ads and Meta Ads. Costs are mapped to channels and campaigns automatically.
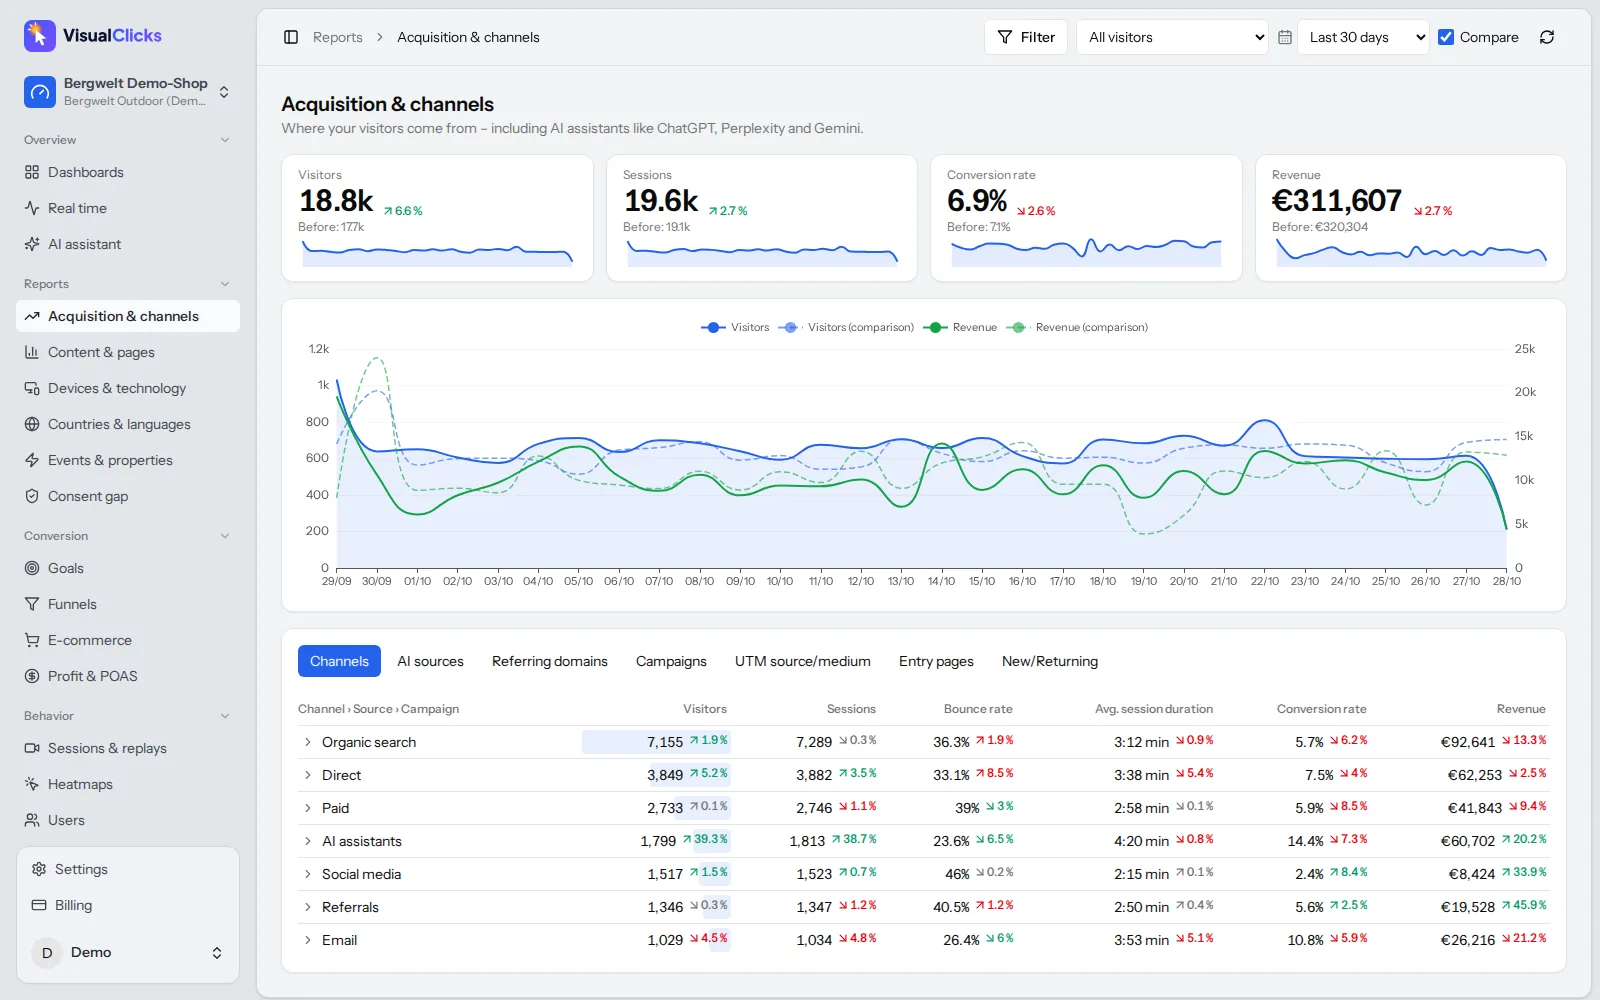
- Contribution margin and POAS per channel, campaign and product, based on your product costs, shipping costs and payment fees. You see right away which campaign is losing money like Campaign B above.
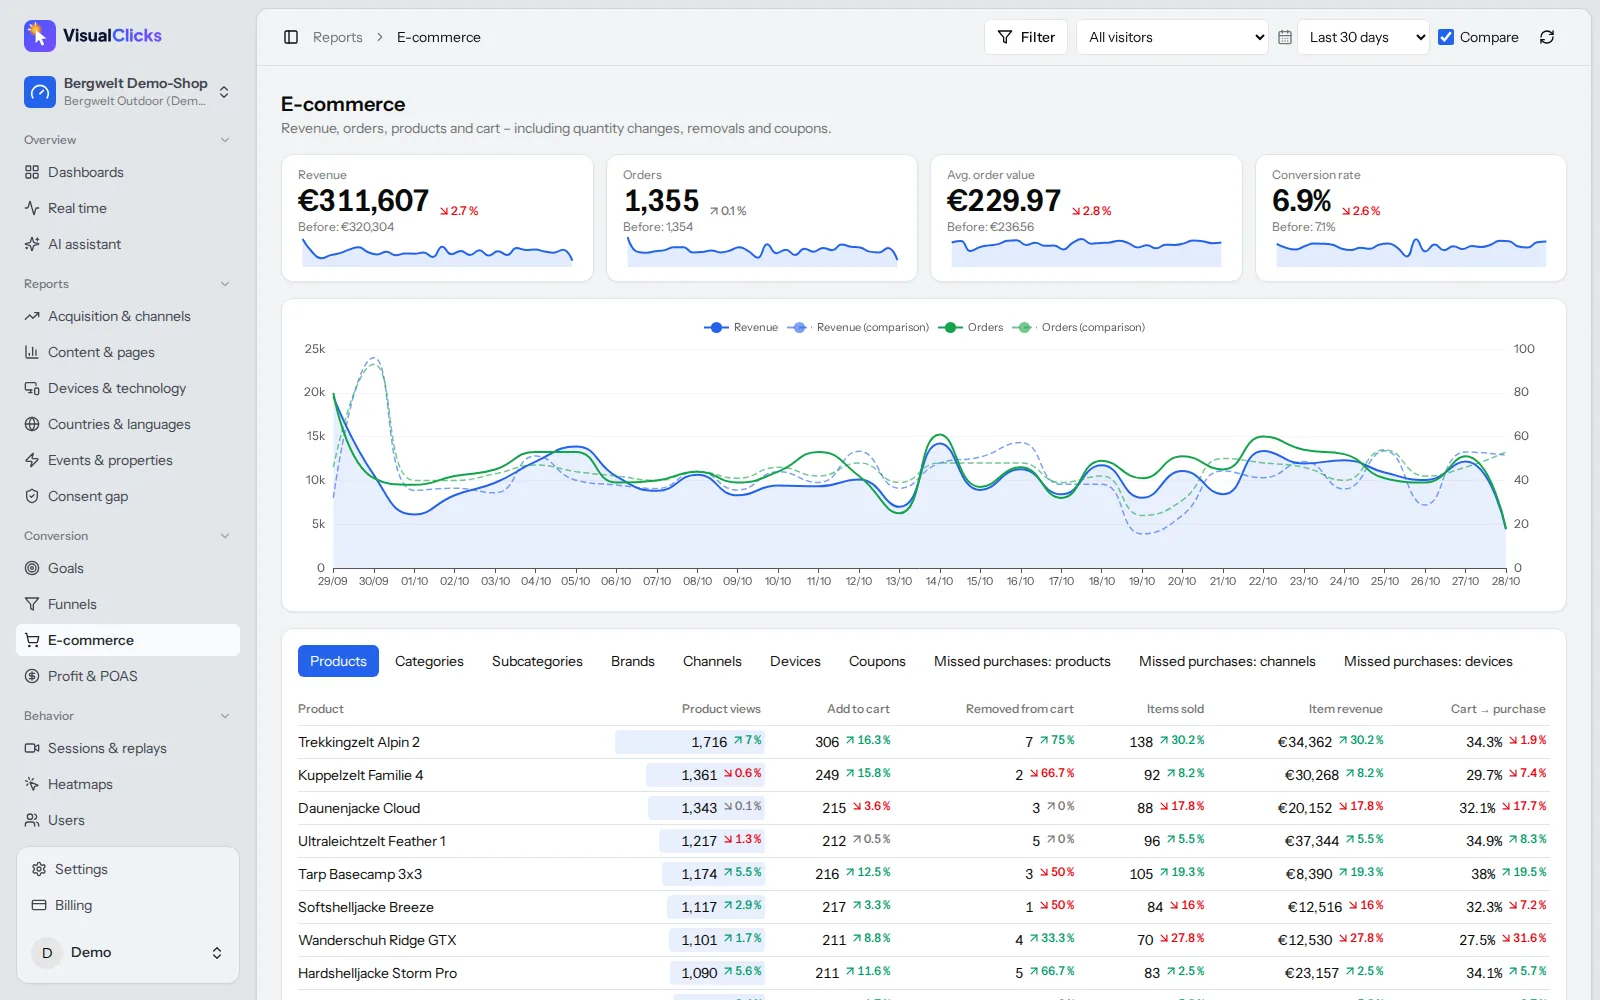
- E-commerce tracking including refunds. Purchases and refunds both flow into the analysis. Free plugins for Shopware 6, WooCommerce, PrestaShop and Magento 2 send cart and order data server-side, so they keep working when visitors use ad blockers.
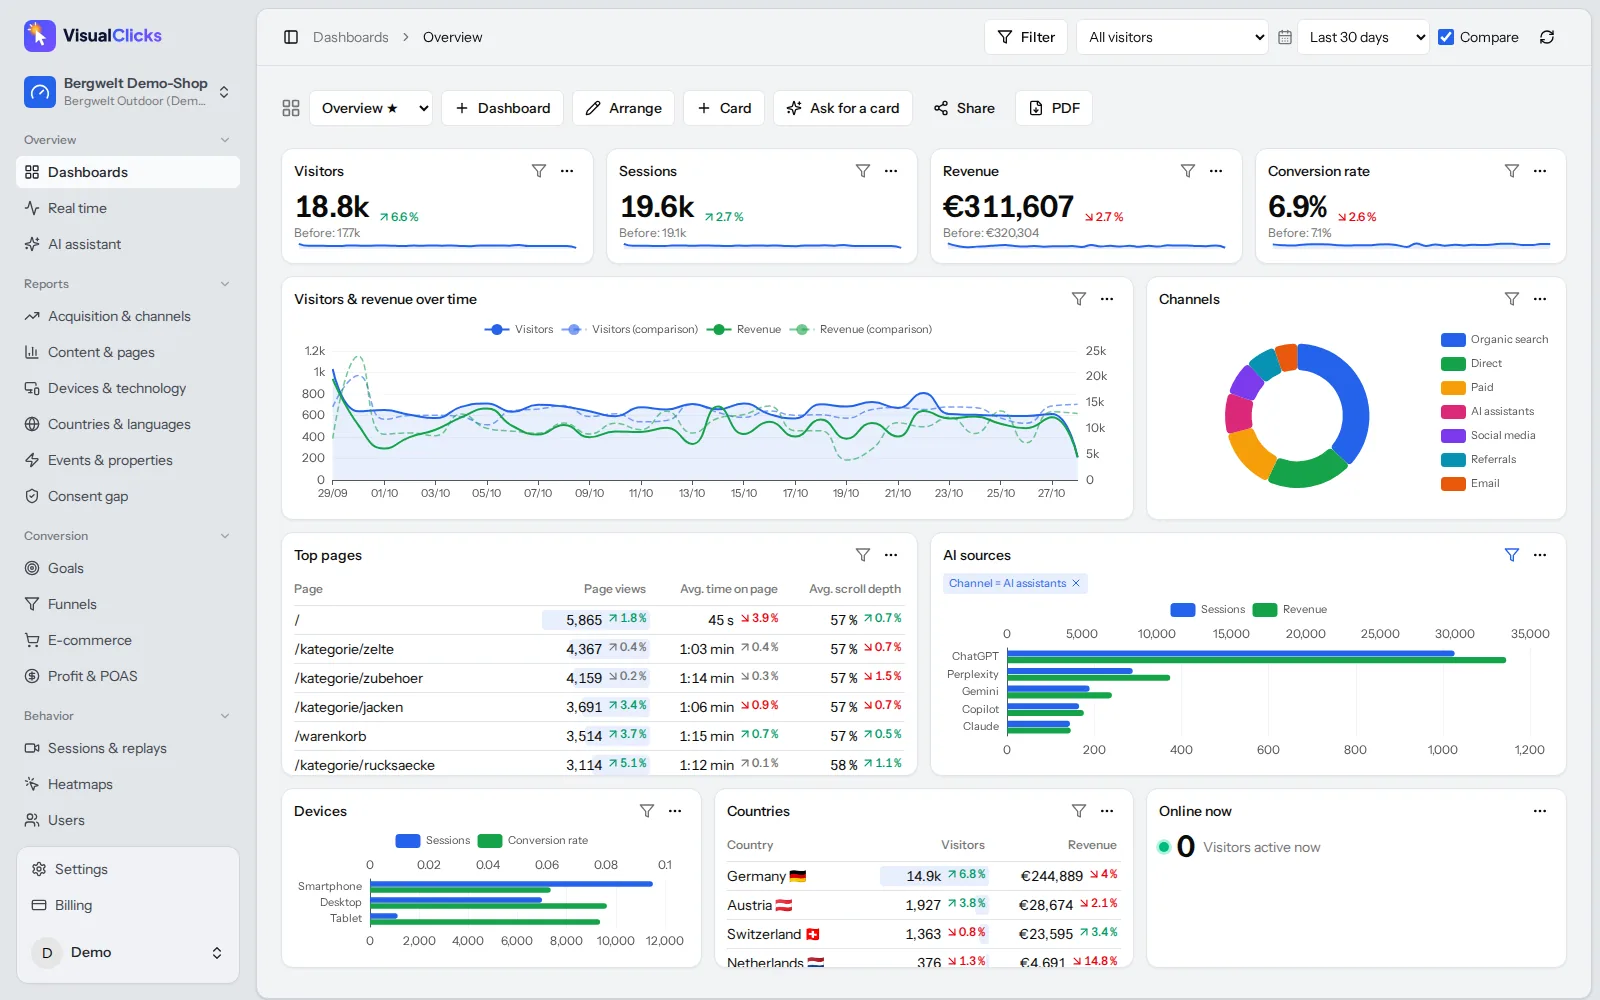
- Consent gap report. It shows how many visits, orders and how much revenue are only visible thanks to cookieless measurement – useful for judging how far platform numbers are from reality.
You can find everything about revenue, carts and profit under e-commerce analytics, and channel and campaign reporting under web analytics.
Conclusion: ROAS shows revenue, POAS shows profit
The ROAS calculation is a good starting point but not a steering tool on its own. Always know where your break-even ROAS sits – it is 1 ÷ contribution margin and varies a lot between products. POAS makes it even simpler: above 1 the campaign earns money, below 1 it does not. Once you consistently factor in margin, shipping, payment fees and returns, you make budget decisions based on profit instead of revenue – and avoid the trap of your best ROAS being your biggest loss-maker.
Frequently asked questions
How do you calculate ROAS?
Divide the revenue a campaign generates by its ad spend. If $1,000 in ad spend brings in $5,000 in revenue, ROAS is 5 or 500%. Make sure revenue and cost use the same basis, ideally net of tax and after returns.
What does POAS mean?
POAS means profit on ad spend. It divides the contribution margin a campaign generates (revenue minus product cost, shipping, payment fees and returns) by its ad spend. A POAS above 1 means the campaign is profitable, below 1 it loses money.
What is a good ROAS?
There is no universal good ROAS because it depends on your margin. What matters is whether ROAS is above your break-even ROAS. With a 25% contribution margin you need at least a ROAS of 4; with a 50% margin a ROAS of 2 already breaks even.
How do I calculate break-even ROAS?
Break-even ROAS is 1 divided by your contribution margin before ad spend. If 30% of revenue remains after product cost, shipping, payment fees and returns, break-even ROAS is 1 ÷ 0.30 = 3.33. Below that, the campaign loses money.
Is ROAS the same as ACoS?
No. ACoS (advertising cost of sale) is the inverse of ROAS: ad spend divided by revenue. A ROAS of 5 equals an ACoS of 20%. Both carry the same information, expressed the other way round.
More articles
 Privacy
Google Analytics Alternative: 5 Tools Compared on the Facts
Why teams leave Google Analytics, what GDPR requires, how cookieless analytics works – and how GA4, Matomo, Plausible, Fathom and VisualClicks compare on verifiable facts.
Read more →
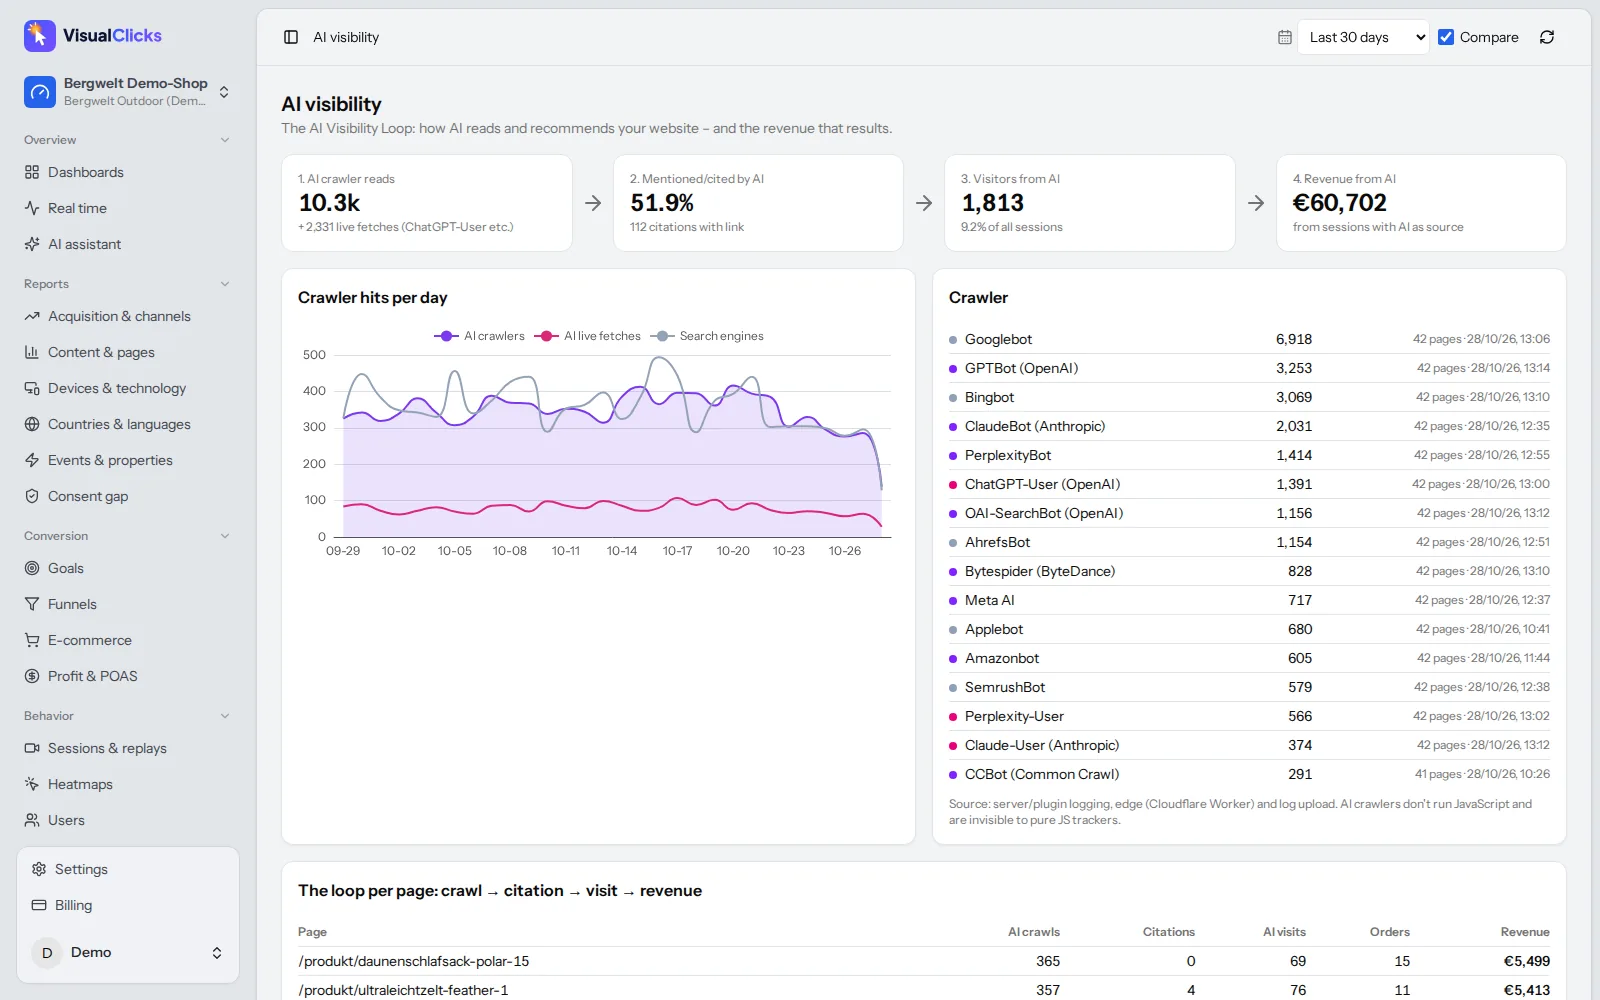 AI visibility
Generative Engine Optimization: How to Get Cited by AI
How AI assistants choose their sources, the seven levers that get you cited, and the tools you need to measure AI visibility on three levels.
Read more →
 Web analytics
What Are UTM Parameters? Meaning, Examples and How to Use Them
What UTM parameters mean, how to build and name UTM links step by step and how to read them in Google Analytics – with a builder template, AI traffic tips and common mistakes.
Read more →
See your website through new eyes
Request your access. After that, one line of tracking code is all it takes – the first visits show up in real time.